

Charts
Navigate candles, use analysis tools, and manage trade overlays.
The Chart area displays server-authorized candle data for the selected symbol and timeframe.
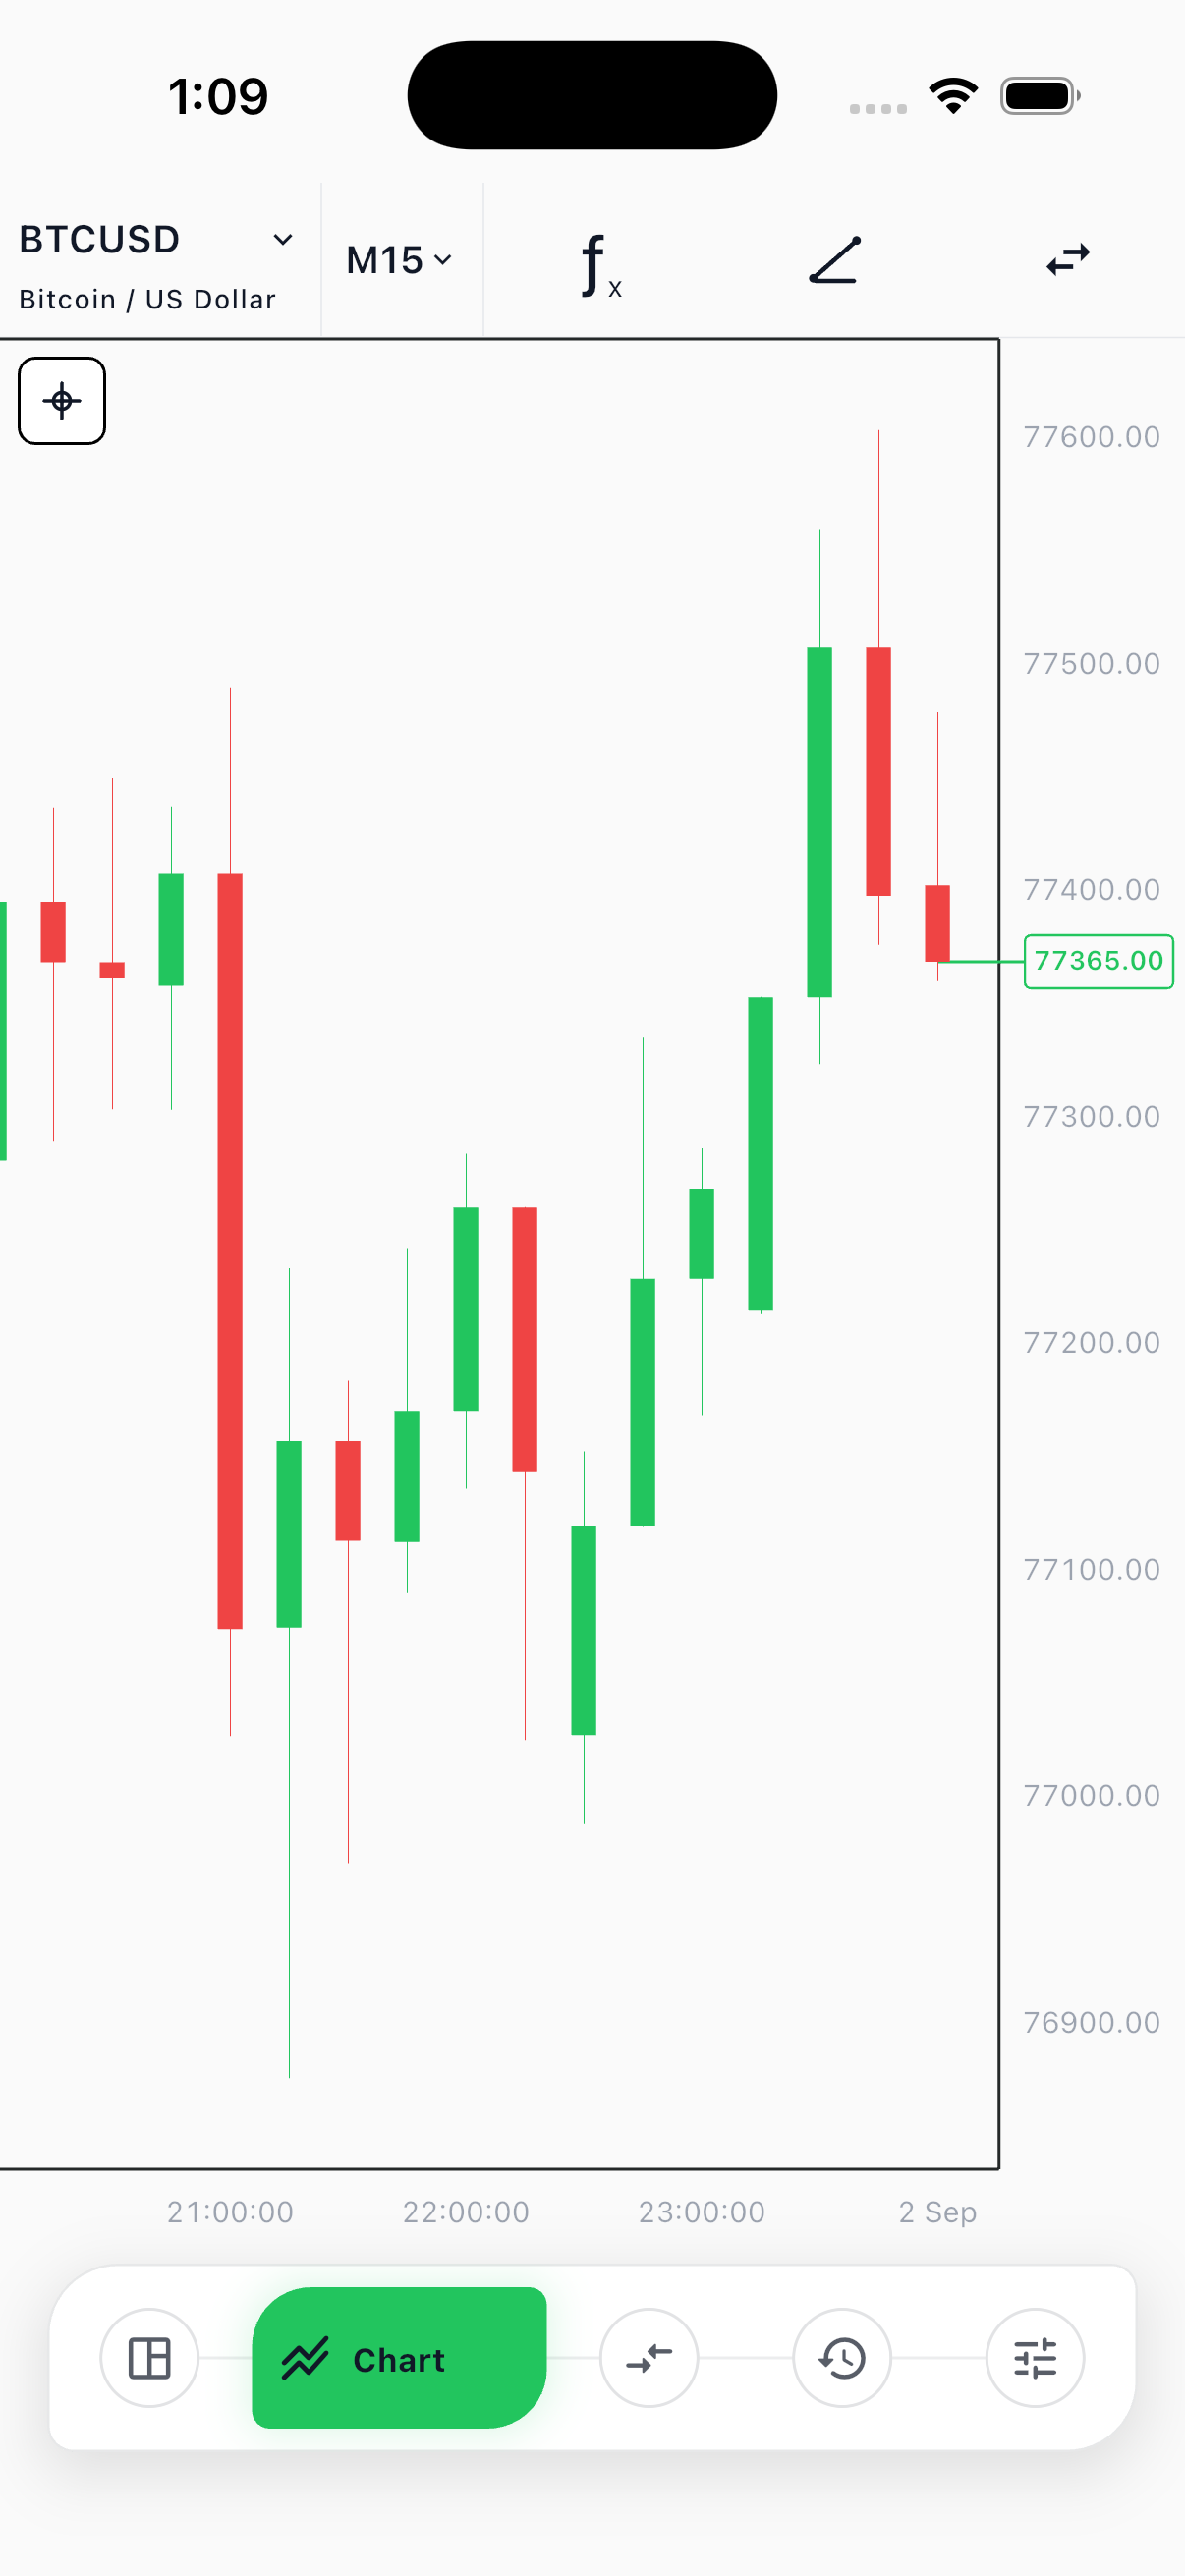
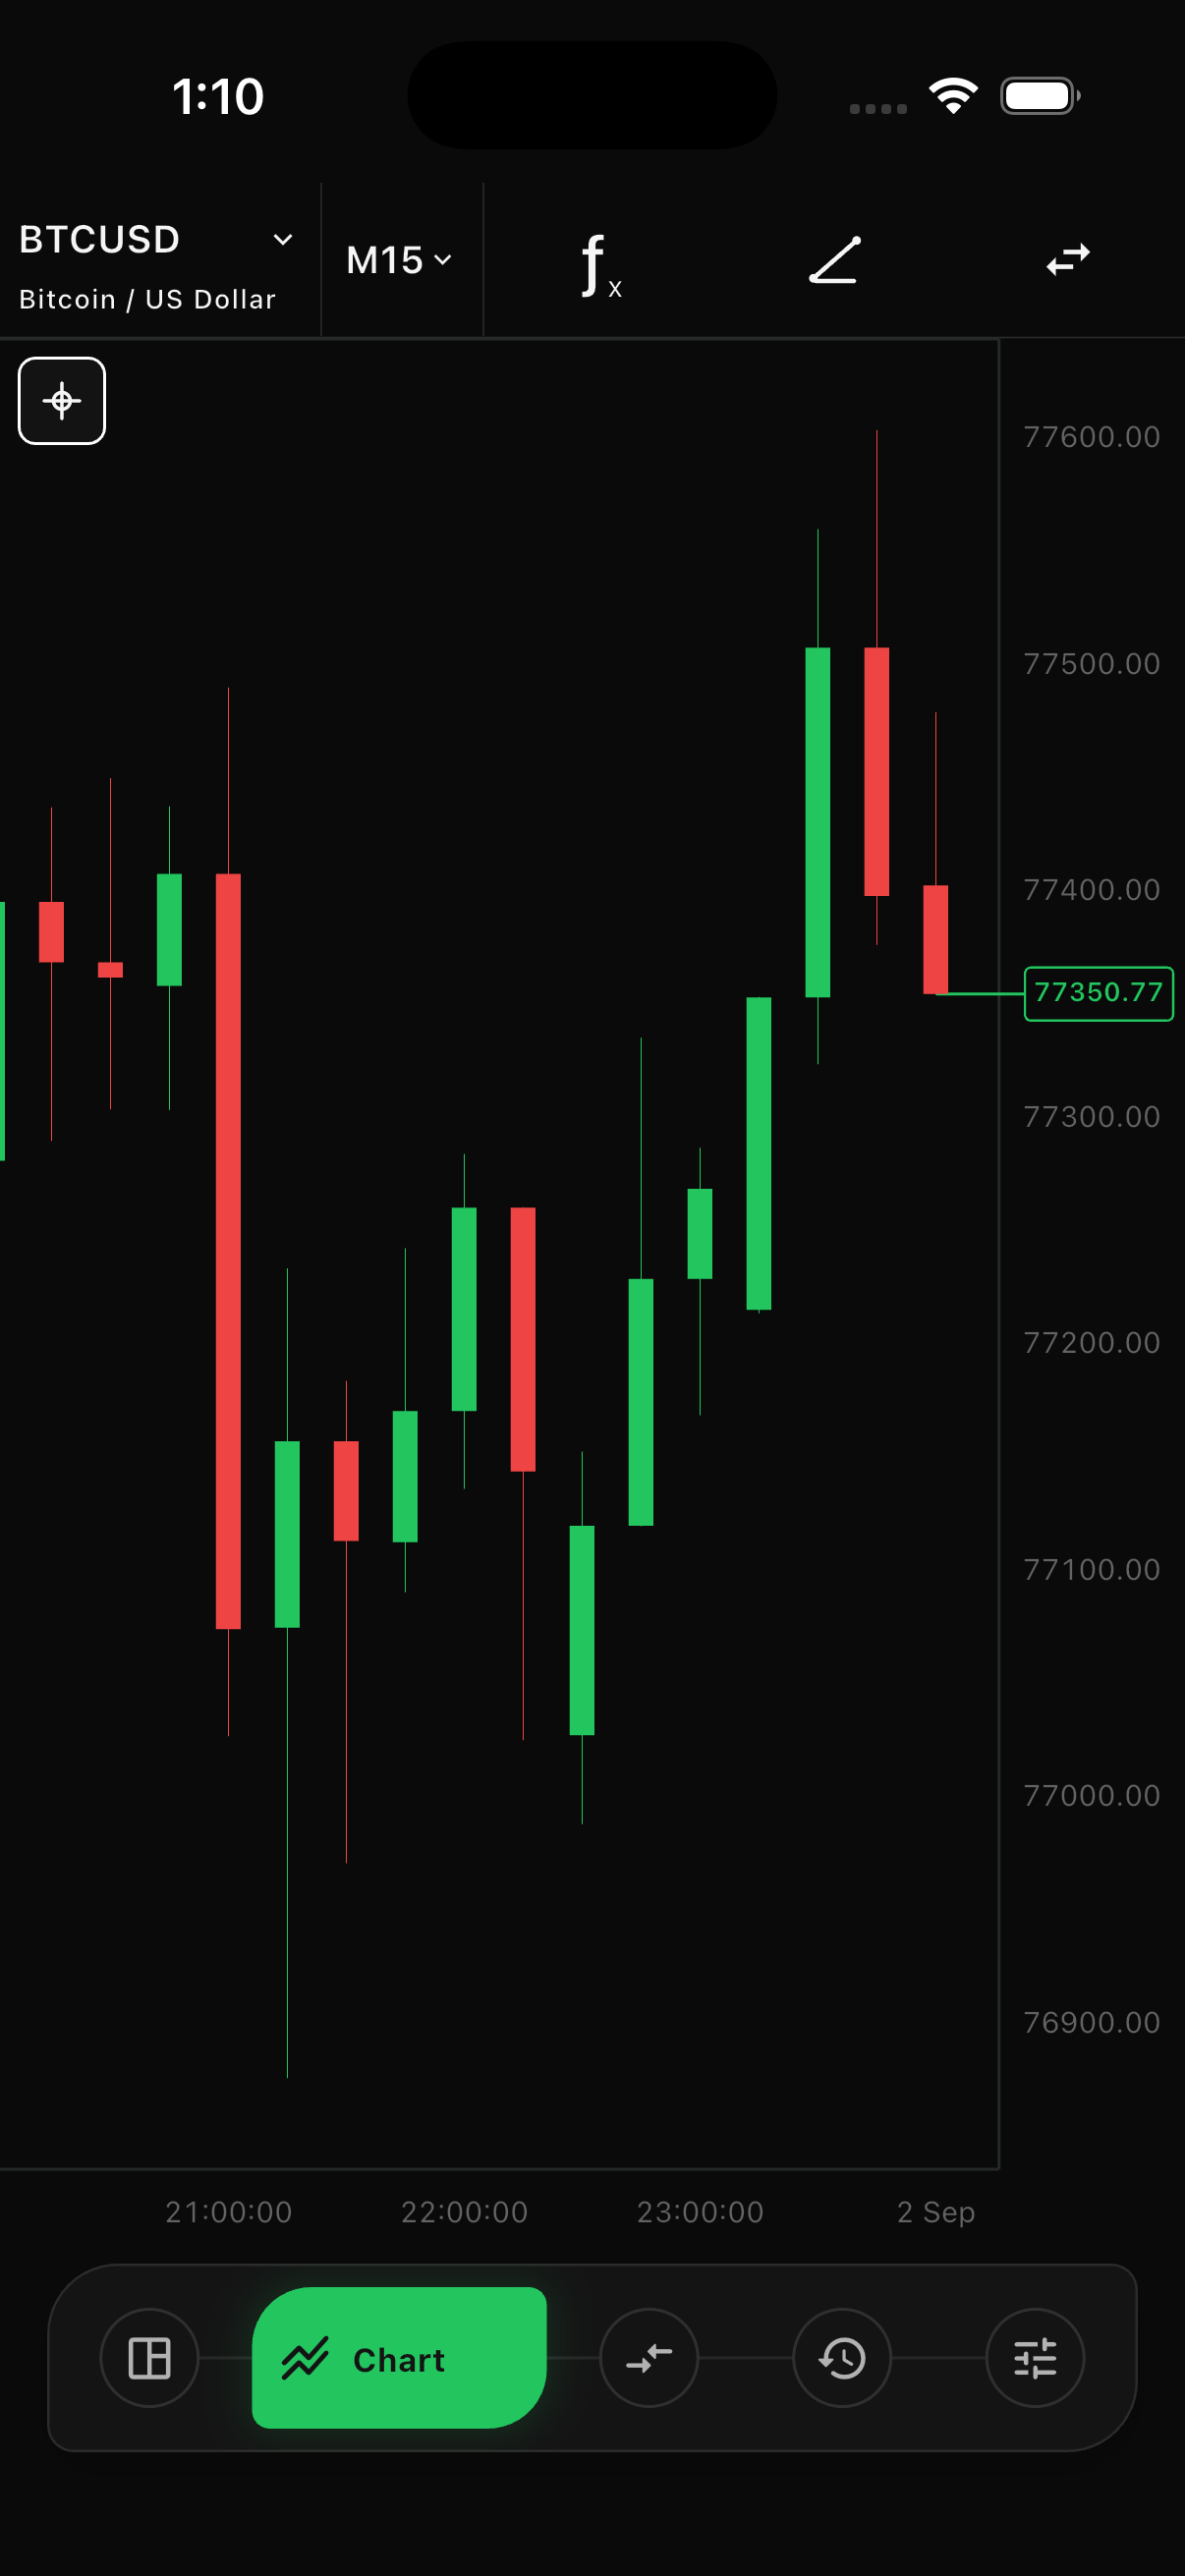
Navigate the chart
Section titled “Navigate the chart”- Drag horizontally to view older or newer candles.
- Pinch on mobile, or use the desktop pointer controls, to change zoom.
- Select the symbol label to choose another market.
- Select the timeframe control to change candle duration.
- Use the crosshair to inspect a candle’s time and price.
The price scale stays in a reserved column on the right. Candles and drawings should remain clipped beneath the chart canvas and must not cover price labels.
Quick trading
Section titled “Quick trading”When quick trading is open, the chart header shows live SELL and BUY prices with the selected volume.
- Confirm the symbol and volume.
- Check that the price is live.
- Select SELL or BUY.
Quick trading submits a market order immediately. Use the full order screen when you need a pending price, stop loss, or take profit before submission.
Indicators and drawings
Section titled “Indicators and drawings”Use the chart tools to add supported indicators and drawing objects. Available controls include drawing selection, object visibility, object management, and clearing drawings.
On web, macOS, and Windows, you can also write local indicators in KS editor, save them to My scripts, favourite them, and add them to an overlay or subwindow. See Custom indicators for the scripting API, safe drawing functions, and .ks and .kic workflows.
Chart settings let you control the default timeframe, candle colors, day separators, trade history, position levels, and other available overlays.
Trade lines and history
Section titled “Trade lines and history”When enabled, the chart can display:
- Open-position price lines
- Stop-loss and take-profit lines
- Buy and sell execution markers
- Dashed connectors between related entry and exit events
Tap or select a trade level before modifying it. Always confirm the numeric value in the position or order details before relying on its visual location.